A few months ago, after my #MusicTech book was published, I’ve spend some hours with Felipe Hoffa, Developer Advocate at Google, talking about several musical data experiments built using the Google Cloud Platform, and specifically BigQuery.
You probably know that I’m a big fan of the Google Cloud Platform, so we had lots of fun discussing how BigQuery facilitates data exploration, analytics and more on large datasets. The result is a 20min video that was published today on Google Cloud Platform channel!
Our discussion was centred around three use-cases that I’ve written about previously, and you can see many live queries about them during the video:
Browsing the Wikipedia dataset, and finding related artists with (that’s the fun part), a single SQL query over 300M rows;
Read about related experiments in my #MusicTech e-book
As our meeting, and this video, were also the opportunity to talk about the #MusicTech e-book, here’s a direct link to get it for $9.99 (+VAT in Europe) for a week.
Hope you’ll enjoy watching the video as much as we enjoyed recording it 🙂 Thanks again to Felipe, and the production team, for the opportunity to showcase my work to a larger audience through the video!
YapMe went live on the AppStore a few weeks ago, and I though I’d share some insights on the engineering side of the product.
While some might this this is “just an app”, I took the decision (from day one, like for seevl), to built it not as a standalone application, but as a platform. In other words, it’s not an ad-hoc photo-app, but an “object-centred sociality” platform, where users:
To put it simply, the Google Cloud Platform is Google’s suite of tools designed to build and host systems in the cloud, using their powerful infrastructure. It includes many components, such as AppEngine (for hosting and running your applications), BigQuery (for large scale analytics), Prediction (for Machine Learning algorithms) or Cloud Endpoints (for building API endpoints and their SDKs), and many more.
While Datastore excel at storing / retrieving entities (Knowledge Graph style), the plain-text query capabilities of the overall platform are, surprisingly, extremely limited. Its search API is disappointed to say the least, as there is no easy way to run autocomplete, fuzzy searches are not supported, indexing is very basic, etc. That’s why we’ve decided to use Algolia to implement our search features – starting with user search.
Algolia: Plug-and-Play Search-a-a-Service
If you’re a reader of this blog, you might remember InstaSearch, my previous experiment with Algolia.
Algolia is Search-as-a-Service, and takes away all the burden of managing plain-text search: building and maintaining indexes, facets, fuzzy-search features, etc. – if you’ve deployed solr in the past, you know what I mean. It puts everything into a friendly – and impressively fast – Web-interface, coupled with a REST API and clients for almost every popular language.
Configuring Algolia’s typo-tolerance
Setting-up Algolia on Google AppEngine
When using Python on AppEngine, you can easily index your data in Algolia using its official Python library. I’ve recently submitted a patch (from 1.7 onwards) which addresses a few issues with the former versions of the library when using it on GAE:
Replacing requests‘ Socket by Google’s urlfetch . While sockets are experimentally supported on AppEngine, they’re more costly than the standard urlfetch and, well, experimental (that said, you lose the advantages of socket connections);
Not-trying to validate Algolia’s domains not hosted under algolia.net (since the API use different falls-back servers), as GAE’s Python doesn’t support SNI, and raised a 40X error when trying to do so.
Since GAE supports virtualenv, you can simply install it by typing
import os
from google.appengine.ext import vendor

vendor.add(os.path.join(os.path.dirname(os.path.realpath(__file__)), 'env'))

def webapp_add_wsgi_middleware(app):
  app = recording.appstats_wsgi_middleware(app)
  return app
And in any of your Web-app or models file
from algoliasearch import algoliasearch
from settings import ALGOLIA_ID, ALGOLIA_KEY, ALGOLIA_INDEX

algolia_index = algoliasearch.Client(ALGOLIA_ID, ALGOLIA_KEY)
    .init_index(ALGOLIA_INDEX)
algolia_index.do_stuff(...)
Synchronize your data using NDB hooks
Last but not least, if you’re using the NDB Datastore API to model your data (as we do to represent users, media, relations, etc. in YapMe), keep in mind the pre/post-hooks available when you create or delete an entity.
You can easily attach any Algolia operation to those. For instance, each time a new user is created, YapMe’s back-end calls Algolia as follows, directly from our User model.
def _post_put_hook(self, future):
    # Some put() do not require re-indexing
    if hasattr(self, '_algolia_index'):
        self.algolia_index()

def algolia_index(self):
    """Index the user into Algolia."""
    Algolia.index_object({
        'objectID' : self.key.urlsafe(),
        'name' : self.name,
        'username' : self.username,
        'photo' : self.get_photo_url(),
        'biography' : self.biography,
        # To check if whoever made the search follows users from the result-set
        'followers' : [u.follower.key.urlsafe() for u in self.get_followers()[0]]
    })
Using this hook-baed approach, entities are immediately sync-ed between your Datastore and Algolia’s servers, making them available right away in any client which uses the same Algolia index.
Below, here’s a example of searching for users in our app, featuring the typo-tolerance feature.
There are two different flavors of time that apply to problems of search. The first is the time it takes the search to run […], the second is the time invested by the programmer who builds the search function […]
I’m glad to say that using Algolia on top of AppEngine solves both issues, and we’re very happy with the decision of using it for YapMe. While GAE and the Datastore provides a solid fondation for all our major Database operations (managing users and their content, fan-out on social feeds, etc.), Algolia brought a plain-text search layer, definitely required from the user-experience perspective, with a minimal effort from the engineering side.
Following my experiments around deep learning and automated media tagging (not only for fun in the music context, but also regarding YapMe that we’re launching very soon), I’ve build a tiny script which combines Clarifai‘s image recognition and Algolia‘s search-as-a-service to visually index my Instagram pictures, and find them in real-time!
You can browse a prototype here, and get the source on github to run it on your own Instagram feed. By using Python bindings of the aforementioned APIs, the full querying-tagging-and-indexing pipeline itself is less than 100 lines of code!
Enjoyed this post? Read about related experiments in my #MusicTech e-book
Tagging Instagram images with Clarifai
After previous experiments focusing on the music vertical, mostly using photograph-made pictures (album covers, video clips), I’ve finally tried Clarifai image recognition API on standard pictures to automatically tag my Instagram feed. The script I’ve build paginates the Instagram API and sends pictures by batch to Clarifai, which tags images immediately.
While there are a few oddities, the result are again very impressive. Here are the two things I enjoy the most about their tagging process:
– It tags at different levels. For instance, it might tag a picture with “beer” but would also add “beverage”, “alcohol” and “drink”. This is particularly useful if a tag which is low in the hierarchy (considering a taxonomy of concepts, e.g. “bottle > alcool_bottle > beer_bottle”) is wrong. A few of my whiskey picture where tagged “beer”, but searching for them with “drink” + “alcohol” allow me to find them in spite of a wrong tag.
– Representing concepts (feelings, abstract things) that are inferred from the elements tagged in the picture. This can go from high-level representations (“spectacle” or “concert” as you can see below) to feelings like “horror” or “scary” for doom-metal album covers. This high-level layer of knowledge representation can be useful in many cases, for instance filtering out scary pictures, without building your own corpus of words related to “scary”, “horror”, etc.
Automatically tagging a concert picture
Indexing and searching with Algolia
To index the tagged images, I had many options such as – among others – using a simple key-value engine like Redis (with lists of pictures associated to each tag), or solr and its facets.
But, similarly to using an image recognition API instead of setting up a GPU-cluster, what about using a simple powerful, Web-based API? So I naturally picked Algolia, the new kid on the block for search-API-as-a-service, already trusted by Periscope, Vevo, (Rap)Genuis and more.
At a glance, Algolia lets you index document and then search them through its API, taking care of all fancy features you can expect from a search engine (ranking, auto-complete, typos, faceting, etc.). It also has a very convenient UI to set-up those index details; for instance, below is how I’ve added a new facets for my images’ tags (extracted from the previous image recognition step).
The search results are displayed in real-time, and the facets (tags) also updated live. More interesting, Algolia supports typos and auto-complete results by default, so typing “cocner” will immediately show-up my concert pictures.
This can be sometimes annoying (if you search for “foot”, you might have “football” pictures first), but the facets help to narrow-down results (thanks @NicolasBaissas for the hint!), and after playing with it for some time, I had to admit the auto-complete by default is very relevant in most-cases.
Fixing typos and auto-completing results
Keep in mind that all those tags have been generated through image recognition, and that only a few lines of code have been used to (1) extract them from the images via Clarifia and (2) index and rank them via Algolia!
The code is available on github, so give it a try if you want to index your own pictures.
Enjoyed this post? Read about related experiments in my #MusicTech e-book
As the JSON object groups timestamps, classes and probs into different arrays (for each video), a quick workaround is needed to transform those into a Python dictionary, that would easily get the tags (and their probability) for each second of each video.
videos = {}
for result in data.get('results'):
  tag = result['result']['tag']
  videos[result['url']] = dict([(
    int(ts),
    dict(zip(tag['classes'][int(ts)], tag['probs'][int(ts)]))
  ) for ts in tag['timestamps']])
You can then find the score of any tag, for any second of any video in the results
>> # Score for cat at second 3 of video_url
... print videos[video_url][3].get('cat')
None
>> # Score for "guitar" at second 8 of video_url
... print videos[video_url][8].get('guitar')
0.911248087883
Parsing YouTube videos
Tagging YouTube videos through Clarifai is a bit more complicated, since you can’t directly give the video URL to the API. Here’s the process I’ve used:
Download videos from YouTube via youtube-dl (disclosure: I’m aware this is against YouTube TOS, but I’m using it as a quick-and-dirty experiment here, please don’t send your lawyers!);
Use ffmpeg to resize videos to 1024, as this is the maximum resolution supported (so far) by the Clarifai API;
Upload the videos to any hosting provider (here, I used Google Storage), and sends that URL to the API.
Done!
Enjoyed this post? Read about related experiments in my #MusicTech e-book
Analysing music videos
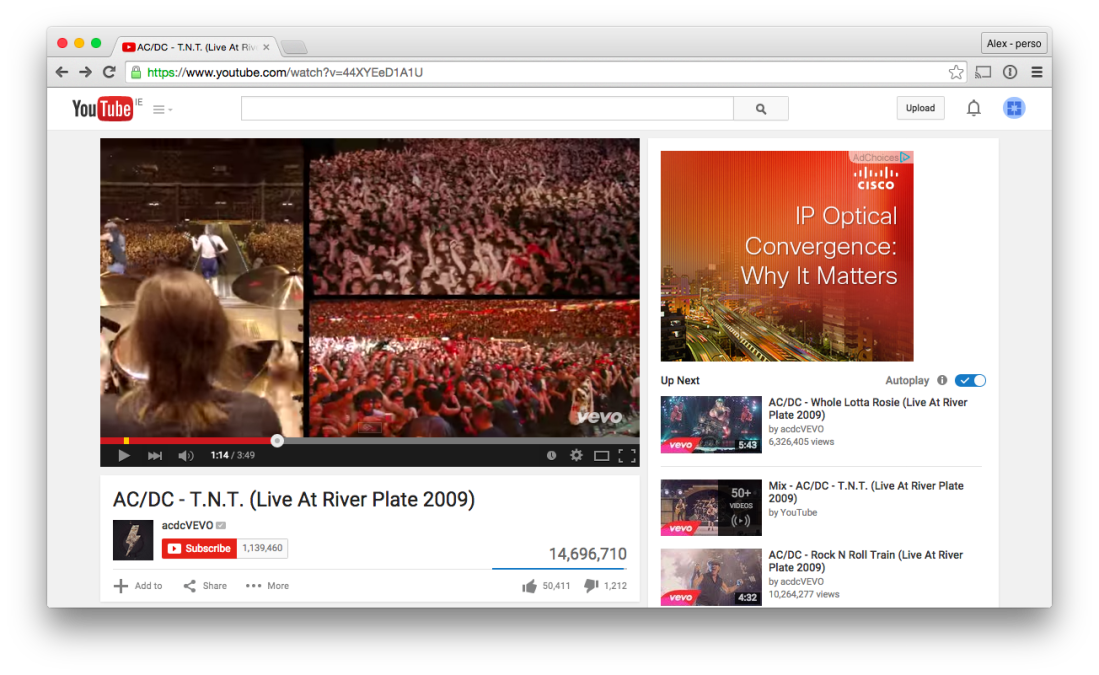
Let’s give it a try with a few music videos, using the pipeline describe before.
First here’s AC/DC’s TNT, live. Picking a particular frame (second 10), here’s the list of tags:
Going further than a single frame, let’s look at the aggregate values to find the top-tags for the whole video. Note that I’m ignoring, for each frame, all tags where the probability was below a certain threshold (0.7).
_tags = {}
for tag in videos[video_url].values():
  for t in [t[0] for t in tag.items() if t[1] > 0.7]:
    _tags.setdefault(t, 0)
    _tags[t] += 1
print sorted(_tags.items(), key=lambda x: x[1], reverse=True)
And the top-10 tags for the video are as follow (the values being the number of time they appear), which definitely makes sense for a rock concert!
That’s all nice and interesting, but besides the fun of parsing videos, this can be useful in many ways.
One could for instance recommend videos based on those tags and a user’s interests; identify when a video is a real performance versus a (bunch of) photo(s) on top of a song [1]; or filter-out sensitive content. Another natural business case is advertisement – with tags like “clothing”, “fashion” and “stylish” extracted from the previous Beyonce video, fashion advertisers could easily target viewers of this video.
The possibilities are endless, and using an image recognition API like this one is just the first building block to leverage video content on the Web!
Enjoyed this post? Read about related experiments in my #MusicTech e-book
[1] Yet, I’ve noticed that for a “static video” (single picture with a music track), the API returns slightly different tags for each of the frame.
It’s been out for a few weeks, but I haven’t blogged about it, so here it is: My e-book #MusicTech is now available on leanpub. It is an evolving summary of what I’ve been working on for the past few years: data science, analytics, recommender systems, and more; in the context of music discovery.
#MusicTech: An e-book on data science, analytics, recommender systems and music discovery
If you follow this blog, you may notice that the book is an edited version of the posts published over the past 18 months or so. Still, this is a more convenient, and also a more consistent, way to read about it. And you can bring it on a plane!
Most importantly, the book will evolve with additional insights, and original content as well. That’s one of the advantage of leanpub both for authors (start with a MVP, and iterate), and for readers (you’ll get immediate access to any update).
In the meantime, and before the first update due in a few weeks, you can get the book here for $9.99 – or more if you want to support it. If you already read it already and have some comments, feel free to reach-out and tell me what you’d like to see in the next releases.
Two weeks ago, I wrote about how I used Clarifai‘s deep learning image recognition API and Google Prediction to identify an artist genre based on their album cover. But what about reversing it, and automatically designing album covers for a particular genre, thanks to the insights from this previous experiment?
Inspired by another machine-learning approach which automatically write Rap lyrics to write new ones, here’s how Clarifai and Flickr helped me to create album covers for an imaginary Doom-metal band!
Read about related experiments in my #MusicTech e-book
Learning about a genre’s iconography
In my previous experiment, I parsed about 300 album covers from different genres (K-pop, Doom-metal, Punk-rock) using the Clarifai image recognition API. Using the API, a set of tags have been extracted for each cover, which allowed me to identify what are the most representative ones for each genre (i.e. the ones frequently appearing for a genre but not in others).
Here’s for instance the most representative tags for Doom-metal (compared to the two other genres of the sample):
horror
fantasy
water
smoke
black and white
history
fire
pattern
sky
scary
Using this list, it became quite easy to automatically design new doom-metal album covers !
Finding and merging the rights images to design the perfect cover
The process to design the cover works as follow:
Select a random tag from the previous list, and query the Flickr API to get the 500 most relevant pictures matching this tag;
Select a random picture from the results, and pass it again to the Clarifai API. Since tags on Flickr are manually assign by photographers, there might be some conceptual mismatch between the tag and the elements contained in the picture. By calling the API again, we can make sure tht the picture contains (as per image extraction) the required tag. If not, revert to step 1.
Repeat the process to get a second picture;
Blend the two pictures with Pillow, and a band name, and the album title (with random fonts and positions), et voila!
So, does that work?
Well, actually, the results are quite fun besides a few oddities – fine tuning would be required to improve the results, but I’ve just designed this in a few hours. Here are a few samples below, from the imaginary album “Louder than Death” of an imaginary band called “Laceration” (I figured out later that a few “metal” bands use this name)
A first one, not too dark, but scary…Then: ‘sky’, ‘water’, ‘dark’ – a good combo of the expected doom-metal tags…Now with a little bit of fire…Finally, another scary one, probably my favorite, even though the title does not fit!
If you want to try on your own, get the source on GitHub. You’ll just need to set-up APIs keys for Clarifai and Flickr.
Read about related experiments in my #MusicTech e-book
With the recent news of image recognition start-up Clarifai raising $10M, I decided to experiment with their Web API. While Deep Learning (the core of their approach) has been used for music streaming, such as recommendations on Spotify, what about the image recognition side of it?
Clarifai’s deep learning API: Machine-Learning-as-a-Service
Clarifai is one of those new services in the Machine-Learning-as-a-Service (MLaaS) area (Azure ML, Wise, etc.). If you think about how Web development evolved during the past years, it completely make sense, as an additional step towards the No-stack start-up.
Many start-ups need Machine-Learning approaches to scale their product: classifying customers, recommending music, identifying offensive user-generated content, etc. Yet, they better outsource this to platforms with a core ML expertise, rather than spending time and resource for this utility – unless that becomes their core business. The same way you don’t buy a fleet of servers and hire dev-ops but use Google App Engine, or don’t set-up a telephony system but rely on Twilio.
Clarifai’s API, which uses deep learning for image recognition, is very easy to use, with a simple API Key / token system and bindings for multiple languages such as as Python. For instance, the following tags Green Day’s Dookie album cover.
from clarifai.client import ClarifaiApi
clarifai_api = ClarifaiApi()
clarifai_api.tag_images('http://assets.rollingstone.com/assets/images/list/0e099b2214b1673fc76c6c60257b88aefe571def.jpg')
The API also lets you provide feedback to the extraction results, this feedback being used to feed their algorithm with additional data.
Read about related experiments in my #MusicTech e-book
SpotiTag: Tagging artists through album covers
The first step of my experiment was to tag artists using their album covers. To do so, I wrote a simple Python class which queries the Spotify Web API to get an artist’s top-10 albums, and pass those to the Clarifai API, filtering broad ones like “graphic”, “art”, etc.
This way, we can find the most relevant tags for an artist, as below.
To bridge the gap between artist-tags and genre-tags, I used “top x songs” playlists from Spotify, starting with two very-unrelated genres: Doom-metal and K-pop! Gathering a small dataset of 140 Doom-metal artist and 102 K-pop ones, and passing them through the previous tagging process, here are the top-tags for both genres.
As you can see with the tags in italic, the overlap is quite large between genres – and I’ll come back to that later. But for now, let’s look at how I used this data to build an artist classifier.
Cloud-based classification with Google Prediction
As its name suggest, Google Prediction is Google’s (cloud-based) Machine-Learning API, predicting an output value for a set of features. It works whether this value is a class (in our case, a music genre), or a continuous value (e.g. the expected number of streams per month for an artist), i.e. classification or regression in ML-terms.
Example of training data in Google Prediction
To predict if a set of tags belong to the Doom-metal or K-pop category, I’ve built simple training set as follows (note that Google prediction splits the string into its own internal model):
genre,"list of tags"
Separating the previous dataset between training and testing lead to 180 examples like the following ones.
doom,"nobody vintage christmas light people nature architecture girl woman paper west history celebration islam traditional astrology event round party background reflection antique dark old shadow conceptual death man postcard back festival east years music fireworks banner couple night female abstract women model adult travel greeting religion card gold street church fine art silhouette style map sepia venice rain broken government country lantern castle color love one nude arms sexy shiny texture pin velvet wall pride"
kpop,"people adult one men north america vintage two vehicle motor vehicle transportation street cap group three police classic car humor hat cartoon outerwear xmas rapper fedora banner christmas jacket musician invitation man celebration background clothing decoration splash necktie text vest facial expression fast wedding automobile audio tape cassette stereo sound mono analogue obsolete record nobody tree radio broadcast compact reel fish eighties tuner unique nostalgia invertebrate conifer noise moon fine art black and white outfit sculpture winter singer season outdoors law nature monochrome greeting fashion menswear women serious dark change boy stroke merry travel garden female face war still life forest music teenager looking leader youth"
In addition, to try different models, I limited the list of tags (in the feature-set) to either all the tags for an artist, or their top-n. The results are as follows for the different approaches.
Model
Success rate
All artist tags
88.71%
Top 100 artist tags
93.55%
Top 75 artist tags
87.10%
Top 50 artist tags
91.93%
Top 25 artist tags
87.101%
Top 10 artist tags
82.25%
The fun part comes next, with a small script that combines the three APIs together to return the expected class (i.e. music genre) for any Spotify artist:
Using SpotiTags to query the Spotify API, get the artist top-10 albums and pass them to Clarifai – build the artist tag-set;
Passing this tag-set to Google Prediction to predict the class, using the former models.
Guessing an artist genre based on their album covers
More genres, more models
That’s all good and fun, but an ideal system would be able classify between more genres, e.g. 10 genres of popular music. I haven’t been so far but added Punk-rock to the equation, in order to try additional models.
Adding 75 Punk-rock artists, let’s have a look at the top-tags:
K-pop
Doom-metal
Punk-rock
people
nobody
people
female
dark
nobody
women
people
vintage
nobody
abstract
north america
men
light
men
isolated
night
text
fashion
old
old
adult
vintage
adult
group
death
street
business
nature
business
As earlier, there is also lots of overlap here. And, as new genres will be added, that overlap is expected to growth. Thus, using the former top-n tags approach, the results are unexpectedly worse than previously.
Model
Success rate
All genre tags
82.50%
Top 100 genre tags
82.50%
Top 75 genre tags
82.50%
Top 50 genre tags
80.00%
Top 25 genre tags
71.25%
Top 10 genre tags
71.25%
Finding the most distinctive tags
So instead of the top-tags, let’s focus on the ones that are specific to the genre. I.e. tags (again, extracted from album covers via Clarifai’s deep learning API), which appear in the top-100 of a genre, but not in the top-100 of others (still, limited to those three ones).
K-pop
Doom-metal
Punk-rock
girl
horror
graffiti
young
fantasy
european
model
water
festival
style
smoke
collection
creativity
black and white
urban
beautiful
history
message
celebration
fire
city
sexy
pattern
performance
shape
sky
cartoon
person
scary
two
This definitely gives a better feeling of what the genre is about: Sexy and beautiful for k-pop, and scary and horrific for Doom-metal!
K-Pop album covers, via Google Images
Using this distinct-tags approach, I’ve updated the previous models (and accordingly, the training and test sets) to take into account not the top-n tags, but the top-n distinct ones.
Here are the results of the new classifiers, deciding if an artist is playing Doom-metal, K-pop or Punk-rock based on their album cover’s tags.
Model
Success rate
Top 100 distincts genre tags
97.50%
Top 75 distincts genre tags
98.75%
Top 50 distincts genre tags
97.50%
Top 25 distincts genre tags
96.25%
Top 10 distincts genre tags
95.00%
Much better than the previous approach. Yet, as the number of genre growth, there will probably a need to find tune those models to accurately identify an artist genre. This means using more examples in the training sets – but also probably additional data, going further than images only, with album titles, and maybe some MIR techniques.
The MLaaS opportunity for developers, and for Clarifai
While being a limited experiment, this post showcases how different elements of a cloud-based machine-learning approach can help to identify what an artist is playing, based solely on what their album cover look like!
More globally, using such APIs definitely simplifies the life of developers and entrepreneurs. While you still need to grasp the underlying concepts, no need for an army of Ph.D.s and a fleet of GPU-based servers running scikit, Caffe or more to understand and make sense of your data!
As for Clarifai itself, I believe that classification and clustering could be two additional features that the former audience would enjoy:
For classification, instead of running a pipeline through another API (as I’ve done here with Google Prediction), managing everything through Clarifai would reduce the integration time and costs. Just think of an API that will, after you’ve send it a few examples, automatically decide if any picture is offensive or not;
For clustering, since the API already accepts images in bulk, returning clusters (with an additional parameter for the number of cluster) would also be helpful. As their premium offering already provides a “similar images” feature, that would follow a similar trend.
And, I’m not even thinking of features outside the image domain (music?), as they’ve already started with video analyzis. In any case, with $10M now in the bank, and a growing team of experts in the area, I have no doubt we will see new features in the API sooner than later, showcasing what deep learning can bring to Web engineering!
Read about related experiments in my #MusicTech e-book
I’ve spend a week in Courchevel (French Alps), and besides seeing our 3 years old daughter discover snow, and proudly wearing her Piou-piou club medal on the slopes at the end of the week, it was also a good opportunity to ski again, enjoy good mountain food, but also to test various iOS skiing apps.
I skied regularly between 3 and 12-ish, but it was only the third time doing it in the past 10 years or so. Needless to say I’m not an expert, but as a data geek, and with a recent interest in sport+technology and quantified-self, I’ve tried a few apps to monitor my week. Here’s a quick summary of what I’ve tried, mostly about two apps that I’ve particularly enjoyed: Ski Tracks and Trace Snow.
A panoramic view of Mont-Blanc from “La cave des creux”
An iPhone and 5 apps in the pocket
To start with, here are the five apps I’ve installed on the first day: Edge, Runkeeper, Ski+, Ski Tracks, and Trace Snow. In order to monitor each day, I wanted to have an experience as frictionless as possible: launch the app in the morning when I’m heading to the cableway, and stopping it at the end of the day. Hopefully with runs / lifts auto-detection, metrics on each run, etc. Pro-tip: don’t put your phone in the same pocket as your hands-free ski-pass, or the pass won’t activate when you’re at the gates.
As expected (since they’re not tailored for Ski), Runkeeper did a pretty bad job at it, simply monitoring the distance with its GPS, but unable to auto-split laps, and most important to differentiate lifts from runs.
I was not really able to experience Ski+ results, as I’ve figured out when looking at it mid-day, that it only recorded a partial run, and stopped recording. A second try did the same, and I stopped using it after a day.
Then came Edge. The design is pretty solid, and very similar to the Strava iOS app, with a simple start button on the home screen, and some analytics at the end of the day. However, besides the limited analytics, those were also wrongly measured (in terms of runs vs lifts, and speed).
Keeping 2 of them after day 1
The two others apps I’ve tested and that I’ll review next, Ski Tracks and Trace Snow, kept running on the phone for the next days. By being available on Android, it was also a fun way to compare metrics at the end of the day.
They both made a very good job at automatically splitting runs and lift without any input, so I didn’t have to think about them during the day – one of my main criteria. Regarding metrics, both apps gather similar analytics (speed, distance, vertical, etc.), with very similar values (at least with an acceptable difference for a skier like me).
The big contrast, besides the community aspect of Trace Snow, is their interface. It is a bit like comparing a Geocities site of 1998 with the last flat-design website from a hype start-up.
Ski Tracks
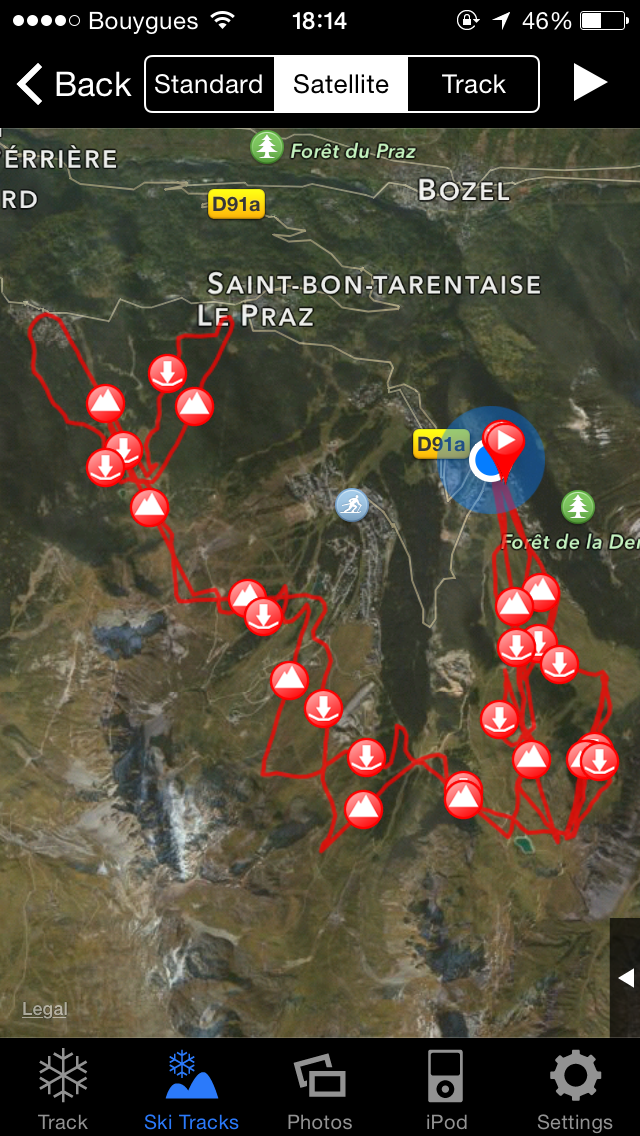
As old-school as it can be, I kept using Ski Tracks during the week. I enjoyed that they can include all relevant data in a single day-screen, and really liked the altitude profile on the screen, showing a different dynamics than the usual maps, also available in a different screen.
Summary of a day skiing with Ski TracksSummary of a day skiing with Ski Tracks (map view)
Regarding the map, it’s actually disturbing to see your ski tracks on a Google map with no snow at all. I wish they’d take their satellite pictures of mountains during the winter! In addition to full view, the app also display statistics for a single run.
Analytics of a single run with Ski Tracks
It is basic, and the interface is indeed very old-school, but it does the job very well, with no fuss. Sharing on Facebook is available on the paid version, but once again it’s not really up-to-date with the latest technologies, simply posting pictures in a dedicated album, without using OpenGraph to display nicer stories in the feed.
Sharing Ski Tracks logs on Facebook
Trace Snow
Last but not least, Trace Snow. A splendid design, reminding me of Strava (like Edge before), and a user interface that allows to quickly swipe from one run to another, with all metrics (and a map) in one page. A nice metric, not available in Ski Tracks, is the Sustained Speed, which is a better indicator than the average speed, especially if you regularly stop when running in groups
Summary of a day skiing with Trace SnowSummary of a day skiing with Trace Snow (map view)
A single run provides the same view, also identifying lift names – which is useful at the end of the day. However, I missed the altitude graph (overall and per run) of Ski Tracks, probably one of the reason I kept using both.
Analytics of a single run with Trace Snow
As for the Facebook sharing, it doesn’t use OpenGraph neither, but uploads a “Session sheet” picture that redirects to the Web view of the session.
And this is a core difference between both apps. While Ski Tracks is “just an app”, Trace Snow is a full platform, with a social network, a gamification aspect (earn badges a-la Foursquare), and more; together with a Web interface so that anyone can browse your statistics for a run, a week or a full ski season.
The Trace Snow web view of a session
The comparison with Strava that I’ve made before hence is not limited to the design only, but to the platform aspect. Even though I haven’t make much use of it, I think it has real potential for ski amateurs and professional to log their data, compete with each others, and more; as Strava is doing for bike and running.
What about next year?
I’m excited to see what’s next for both apps – and others plus newcomers – as I’m already impatient about my next ski trip, to run more slopes, and gather more data!
Actually, it’s likely that I’ll try the Recon Snow2, for their live data but also make use of their dashboard with complete analytics, including slopes names, colours, and more, as you can see in this ski trip and gadget review from DC Rainmaker. Plus, I’ve just ordered a Polar V800, so I’m looking forward to see what their ski profile is about.
I’ve spend the past few months building YapMe, and our first MVP was released on the AppStore a few days ago! The app aims to bridge the gap between photos and videos, letting users to take pictures with ambient sound, up to 25 seconds, in a single click.
To build it, I’ve decided to fully rely on the Google Cloud Platform: App Engine, Datastore, Endpoints, and more. I’ll blog about the overall experience later, but here’s a quick post about a particular topic: Task Queues.
While Crashlytics and Google Analytics calls are done directly through the device, Intercom calls are done in the back-end. So for instance, when adding a new followee, instead of doing
- (iOS) /POST add_followee to YapMe
 -- (YapMe back-end) User.add_followee(other)
 -- (YapMe back-end) 200 OK
 - (iOS) /POST add_followee to Intercom
 -- (Intercom back-end) set "add followee" metric
 -- (Intercom back-end) 200 OK
Or
- (Android) /POST add_followee to YapMe
 -- (YapMe back-end) User.add_followee(other)
 -- (YapMe back-end) 200 OK
 - (Android) /POST add_followee to Intercom
 -- (Intercom back-end) set "add followee" metric
 -- (Intercom back-end) 200 OK
We simply do
- (Android | iOS) /POST add_followee to YapMe
 -- (YapMe back-end) User.add_followee(other)
 -- (YapMe back-end) /POST add_followee to Intercom
 ---- (Intercom back-end) set "add followee" metric
 ---- (Intercom back-end) 200 OK
 -- (YapMe back-end) 200 OK
Here are a few reasons for this:
Unlike Crashlytics or GA, our Intercom metrics are not directly related to the app (e.g. session length) but to actions on database entities (e.g. creating a new yap, or following a user). As those actions are recorded in the back-end, it makes sense to gather the metrics at the same time;
Some metrics are conditional, and those conditions are evaluated on the back-end (e.g. “has the media been already shared by the user?”). Pushing metrics from the app would require another layer of back-and-forth between the device and the API;
We’ll eventually have multiple clients (iOS, Web, Android), so having the metrics handled on the back-end avoids us to implement those on any client, especially useful when update are required: this can be done on the back-end without pushing new app releases.
Pinging remote endpoints with Task Queues
Initially deploying those back-end metrics with a simple urlfetch (GAE API to handle remote requests), I was bugged by some queries which were more time consuming than expected. Using the new Cloud Trace tool, I’ve noticed that the Intercom queries where taking a while on the back-end, as seen on the log trace below, representing the track of an API call on our back-end, while the two urlfetch.Fetch() calls are used to call the Intercom API.
Using Cloud Trace to debug remote API calls
There are a few solutions to handle this, and to make sure the main API call continues without waiting a reply from Intercom (I don’t really care if the call a success or not, we’re OK losing a metric if something happens):
Use async urlfetch requests. Yet, it keeps the connection open while I just want a simple ping and don’t need to handle the query result;
Use a Python thread. In this case, the task is threaded (so the main API call can exit) but it runs on the same instance(s) as the one that initiated the thread, consuming resources on those;
Use a Task Queue. The Intercom query is pushed in a separate push queue, that is immediately processed and auto-scales, delegating the work to a new module in our case.
Which gives the following trace result. It takes less than 10% of the original time, and delegates all the process and resources to another module, so that one and the related instances are not overloaded by simple pinging tasks.
Pushing remote API calls in a Task Queue
Note that we’re using the same approach to implement push notifications, which are now available in our new release. In both cases, pushing data into the queue and handling it is straight-forward, as described in Google’s push queues tutorial. Note that pull queues are executed on App Engine, which means you cannot do advanced processing (such as image processing). For those, we rely on pull queues. More about this later.
With CES starting tomorrow, I though it would be a good time to reflect on the future of music streaming, and what’s needed to own the space. Not only because the conference holds a session on this very topic, but also because advances in Data Science, wearables, and context-aware computing could bring brand-new experiences regarding how we consume – and discover – music.
The need for discovery and personalisation
Besides a few exclusive artists, such as Thom Yorke on BandCamp, or Metallica on Spotify, mainstream services (Deezer, Rdio, Rhapsody, iTunes radio, Pandora, etc.) tend to have very similar catalogues. As music streaming tends to be a commodity, those services need to find incentives to let users choose them versus competitors.
While one way to do so is to focus on Hi-Fi content (as done by Pono Music or Qobuz), another aspect is to invest more time – both on product and R&D – on personalisation and discovery, in order to be ahead of the pack and own the space. That’s an obvious strategy, and a win-win-win for all parties involved:
For consumers, delighted when discovering new artists they’ll love, based on their past behaviours or the streaming habits of their friends; and when figuring out that those platforms really understand what they should listen to next;
For streaming services, keeping existing users active and adding new ones; consequently gathering more data and analytics (plays, thumbs-up, social networks, etc.), re-investing this into new product features.
That being said, the music-tech consolidation that happened over the past few months is not surprising: Spotify + Echonest, Rdio + TasteMakerX, or Songza + Google, etc. Interestingly, they showcase different ways that music discovery can be done: “Big Data” (or, should I say, smart data) for the Echonest, social recommendations for TasteMakerX, or mood-based curation for Songza. But one approach doesn’t fit all, and they’re often combined: let’s look at your Spotify homepage and see the different ways you can discovery music (“Top lists”, “Discover”, etc.) if you’re not convinced about it.
Various ways to discover new music through Spotify
How hardware and context could help
Considering all those ways to discover music: what’s next? Well, probably a lot.
On the one hand, advances in large-scale infrastructures and AI now make possible to run algorithms on billions of data-points – combining existing techniques such as Collaborative Filtering or Natural Language Processing, as well as new experiments on Deep Learning;
On the other hand, social networks such as Twitter or Facebook provide a huge amount of signals to identify user tastes, correlations between artists, trends and predictions and more – which could go further that discovery by creating communities through music-based user profiling.
But I think that the most exciting part resides in context-aware recommendations.
Remember Beats’ “The Sentence”? Or Spotify’s activity-based playlist (“Workout”, “Focus”, etc.)? Well, this is all good, but it requires manual input to understand users’ context, expectations and short-term listening goals.
Generating Music with Beat’s “The Sentence”
We can soon expect this to be generated automatically for us, using the wide range of sensors we have in our cars, houses, or bodies (from smart watches to Nest appliances), and information we already provided to other services we use daily.
Building the future of context-based music personalisation
What about a Spotify integration with Runkeeper that automatically detects when you’re in the last mile of this race, and plays “Harder Better Faster Stronger” to push yourself through? Or your car’s Rdio automatically playing your friends’ top tracks when you’re joining them at a party recorded in your Google calendar? And, at this particular party, should Nest send signals to Songza / YouTube to play some funky music when it’s calming down and there’s no more energy in the room?
This obviously require some work to make those services talk intelligently to each other. But we’re already there, with the growth of APIs on various fronts (music, devices, fitness, etc.), and standards such as schema.org and especially their actions module. CES will be a perfect time for wearable manufacturers, streaming services, and data providers to announce some ground-breaking partnerships, putting context as a first-class citizen of music discovery and personalisation. Let’s wait and see!